Customize Dashboard widgets
The Dashboard provides a quick view of your services and related information such as service requests, costs, resource usage, quota usage and important messages. You can customize the widget name and how the information is displayed on the dashboard.
The information that's displayed may differ depending on the types of services that you have access to.
- Hover over a widget and click Edit.
- In the Widget Settings page, customize the Widget settings.
For example, a default title is provided. You can change this default title. Some widgets have other configuration and view options that you can set.
- Click Save.
The widget is updated on your dashboard.
Group services in the Applications widget
You can change how you group your services on the dashboard. For example, you can group VMs by Guest OS.
- Hover over the Applications widget and click Edit.
- From the Group by drop-down list, select a category.
- Click Save.
Display DNS names for VMs in the Applications widget
If you want, you can identify your VMs by DNS name.
- Hover over the Applications widget and click Edit.
- Next to VM Name Display, select Show DNS.
The DNS names will now display when available.
Customize reports in the Reports widget
Once you have created reports, you can choose to display up to four reports on the dashboard for easy access.
- Hover over the Reports widget and click Edit.
- On the Widget Settings page, move up to four available reports to the displayed reports column using the arrow buttons or drag and drop.
- Click Save.
Customize view in the Month-to-date Cost widget
- Click Edit to change the title of this widget.
- Click the Table icon to see the table view and the Chart icon to see the chart view.
- The data on this widget can’t be filtered. You can filter the data on the Cost Dashboard Month-to-date Cost chart and table. For more information, see Filter Cost Dashboard data.
- You can set the budget amount on the Cost Dashboard Month-to-date Cost chart and table. For more information, see Display a monthly budget amount.
Customize properties in the Details
When you select a service, you can change what properties appear and the order in which they appear in the Details. Your changes apply to all services.
For example, you may only want to display details about the monthly cost and the logical disk size.
To customize the properties you see in the Details drop-down panel:
- On a service summary page, click in the Details drop-down panel.
The Property Selection dialog appears, displaying the list of properties that are available and displayed in the Details drop-down panel. The properties vary based on the service type and the cloud platform.
You can use the search field to narrow your view of available properties.

- Use the arrows or drag and drop to change what properties appear on the Details drop-down panel and what order they appear in.
You can display an unlimited number of properties.
- Click Update Properties.

Customize the table view
In addition to filtering capabilities, all tables allow you to sort on most columns by clicking the column headers. You can also resize the columns to adjust your view. The Column size set for tables on the Applications, Tasks, and Recommendations page is preserved if you sign out and sign back in.
The Service Requests table allows you to:
- Choose which columns are displayed by clicking Display Options and selecting columns in the list.
- Re-order columns by dragging column headers.
- Export the table in CSV format by clicking Export.
The Applications table allows you to switch from a list view to a tree view .
Resources in a list view are ordered alphabetically by resource name. Similarly, resources in a tree view are also ordered alphabetically by resource name, but also include child resources managed as a group. Child resources aren't ordered alphabetically.
In a tree view, click beside the type icon for a parent resource to expand the tree and display its children. For example, the image below shows a parent stack resource that includes a database and an auto scaling group with two VMs.
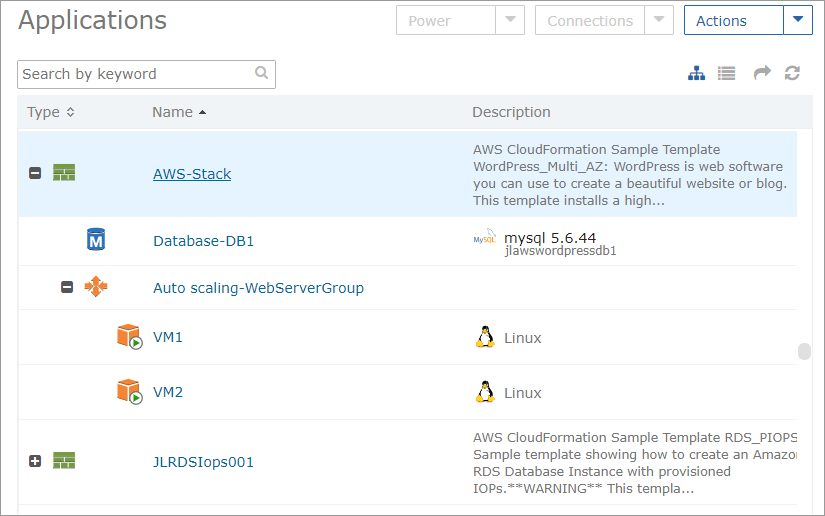
To see child resources in a tree view, you must have resources that are managed as a group such as GCP deployments, AWS stacks, and auto scaling groups, vCenter virtual services, and Azure resource groups. Otherwise, resources displayed in a tree view will appear the same as in a list view.
