Maintain the Commander Environment
After you have successfully deploy Commander in AWS, you should observe the following best practices to maintain the Commander environment.
Back up the Commander database
Backing up the Commander database is critical. Backups should be scheduled during off-peak hours when fewer users will require access to the system. For more information, see the Snow Globe article Backup the Commander Database with SQL Management Studio.
For more rapid recovery of customer data, it's recommended that you enable Amazon Relational Database Service (RDS) automated snapshots. For more detailed steps for backup and recovery of the RDS instance, create a case through the Snow Support Portal.
Create and restore Amazon RDS snapshots
For details on creating RDS snapshots, see Creating a DB snapshot in the Amazon documentation.
For details on restoring automated RDS snapshots, see Restoring from a DB snapshot.
When using RDS snapshots for recovery, the recovery time objective (RTO) is 30 minutes.
Consider your business requirements and plan a defined recovery point objective (RPO) before configuring backup for your database.
For help with your RTO or RPO requirements, create a case through the Snow Support Portal.
Monitor the Commander environment
You can use Amazon CloudWatch to monitor the Commander database, load balancer, and application server. You should monitor the operating status of the Commander services as well as performance metrics.
Besides using CloudWatch, you can use the Commander log files to check for errors and use the Commander API to monitor the observation and events queues.
For more information, see Monitor and Maintain Commander
Collect Commander logs and metrics with CloudWatch
If you install the CloudWatch agent on the EC2 instance hosting Commander, you can use CloudWatch to collect Commander logs and metrics.
To install the CloudWatch agent, see Collect Metrics and Logs from Amazon EC2 Instances and On-Premises Servers with the CloudWatch Agent.
C:\\Program Files\\Embotics if the path to your Commander installation is different:
{
    "logs": {
        "logs_collected": {
            "files": {
                "collect_list": [
                    {
                        "file_path": "C:\\Program Files\\Embotics\\vCommander\\tomcat\\logs\\vcommander.log",
                        "log_group_name": "vcommander.log"
                    }
...
Configure alerting
To handle failures due to hardware, software, availability zone or region issues, configure alerting.
One fairly straightforward but effective method involves configuring a CloudWatch alarm with an Amazon Simple Notification Service (SNS) topic to send an email or text message when a system has failed. In the Commander case, an SNS notification would be sent if the load balancer detects that the HealthyHostCount metric has dropped below 1.
To configure SNS alerting through email using CloudWatch, follow the steps below.
Create and subscribe to an SNS topic
- Sign in to the Amazon SNS console.
- Navigate to Topics and click Create Topic.
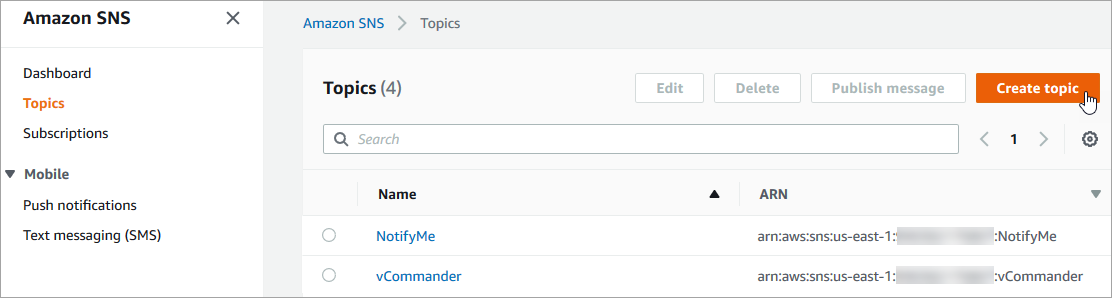
- In the Create new topic dialog, enter a Topic name, such as "Commander_load_balancer_health".
- Click Create topic.
The Topic ARN is displayed.
- Copy the Topic ARN for use in a future step.
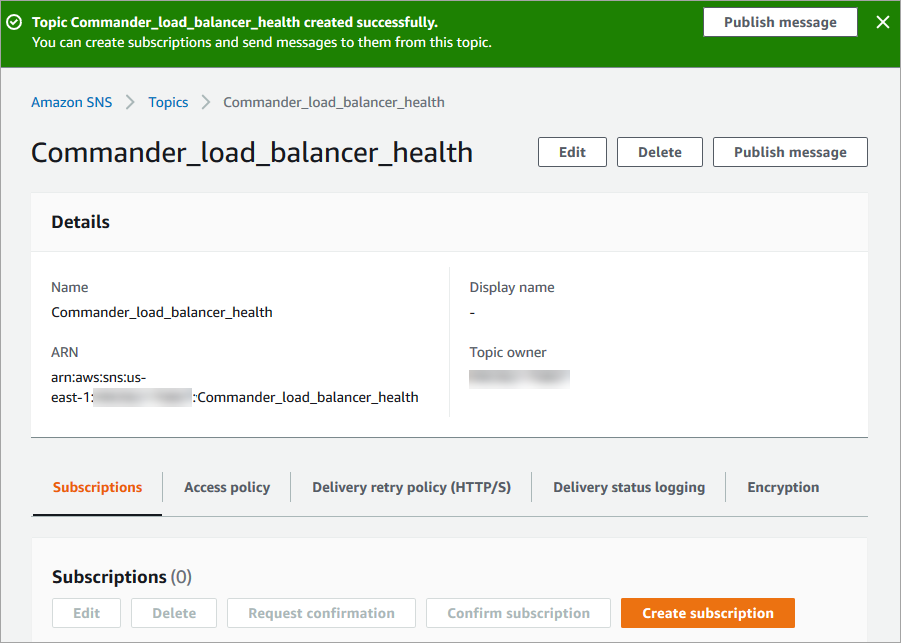
- On the same page, under Subscriptions, click Create subscription.
- On the Create subscription page:
- Paste in the topic ARN.
- For Protocol, select Email.
- For Endpoint, enter an email addresses where emails should be sent.
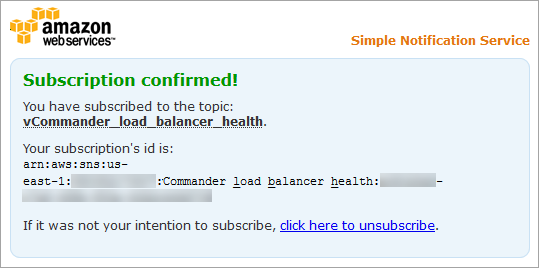
- Open your email and confirm your subscription.
A confirmation is displayed.
- Go back to the Amazon SNS console.
The subscription status is displayed as Confirmed.
- On the Topics page, select the topic and click Publish message.
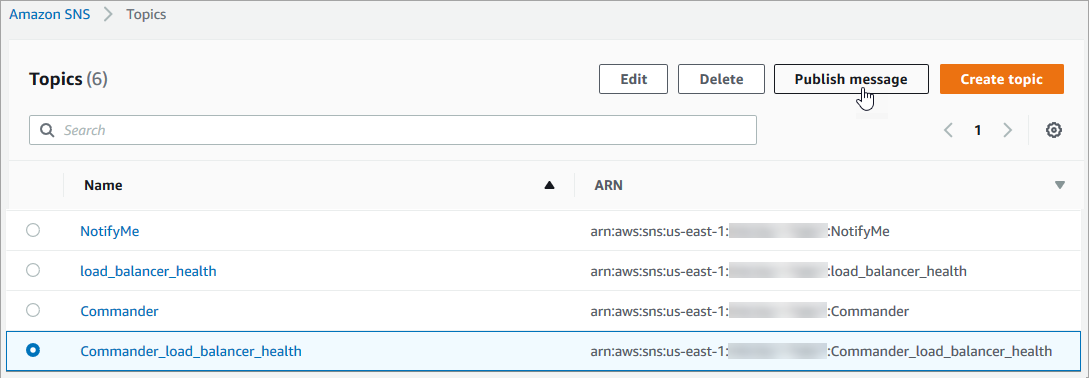
- On the Publish message page, enter a Subject and Message for the test email.
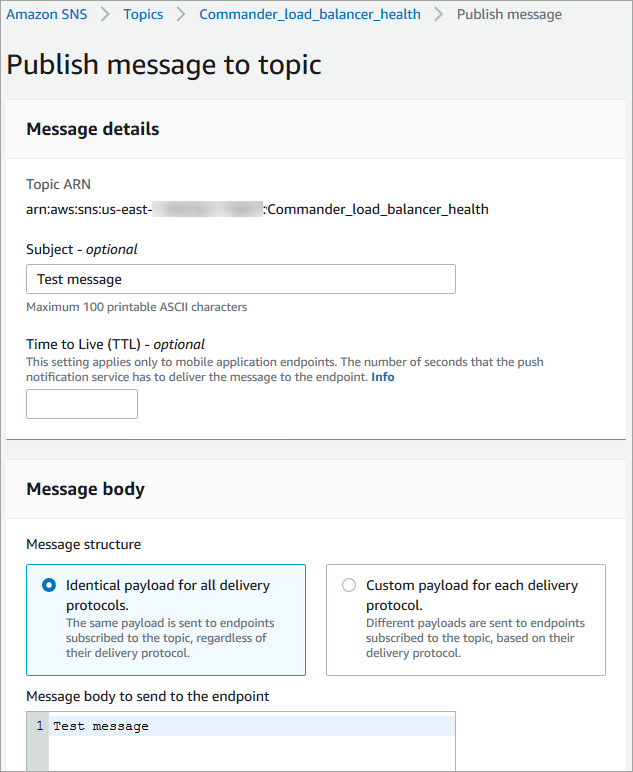
- Click Publish Message.
- Check your email to confirm that you received the message.
Create a CloudWatch alarm based on a CloudWatch metric
- Sign in to the Amazon CloudWatch console.
- Navigate to Alarms and click Create Alarm.
- Under Metric, click Select metric.
- On the Select metric page, click ELB.
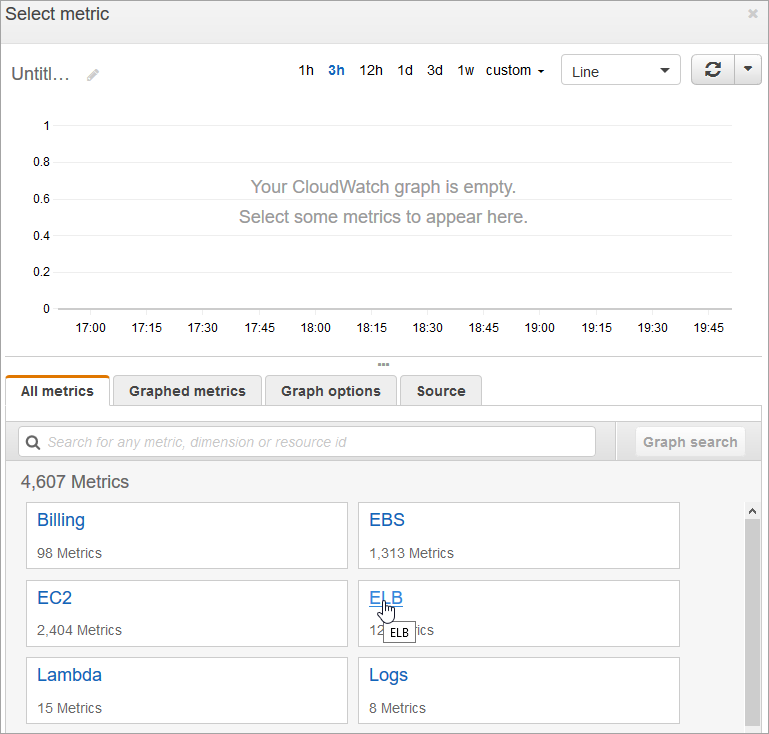
- Select the box next to your load balancer’s HealthyHostCount metric and click Select metric.
- Under Alarm details, enter a Name and Description.
- Set the threshold for HealthyHostCount to be less than 1, for 1 consecutive period.

- Under Actions, from Send notification to, select the Commander_load_balancer_health topic.

- Click Create Alarm.
Upgrade Commander regularly
Regularly upgrading Commander ensures that you benefit from the latest features and fixes. Running the latest version also means Support can troubleshoot issues more easily and provide fixes more quickly.
For more information, see Upgrade Commander.
Snow Software does not own the third party trademarks, software, products, or tools (collectively, the “Third Party Products”) referenced herein. Third Party Product updates, including user interface updates, may not be reflected in this content.
